Desert Online General Trading LLC
Dubai, United Arab Emirates
Desert Online General Trading LLC
Dubai, United Arab Emirates
Full description not available
A**H
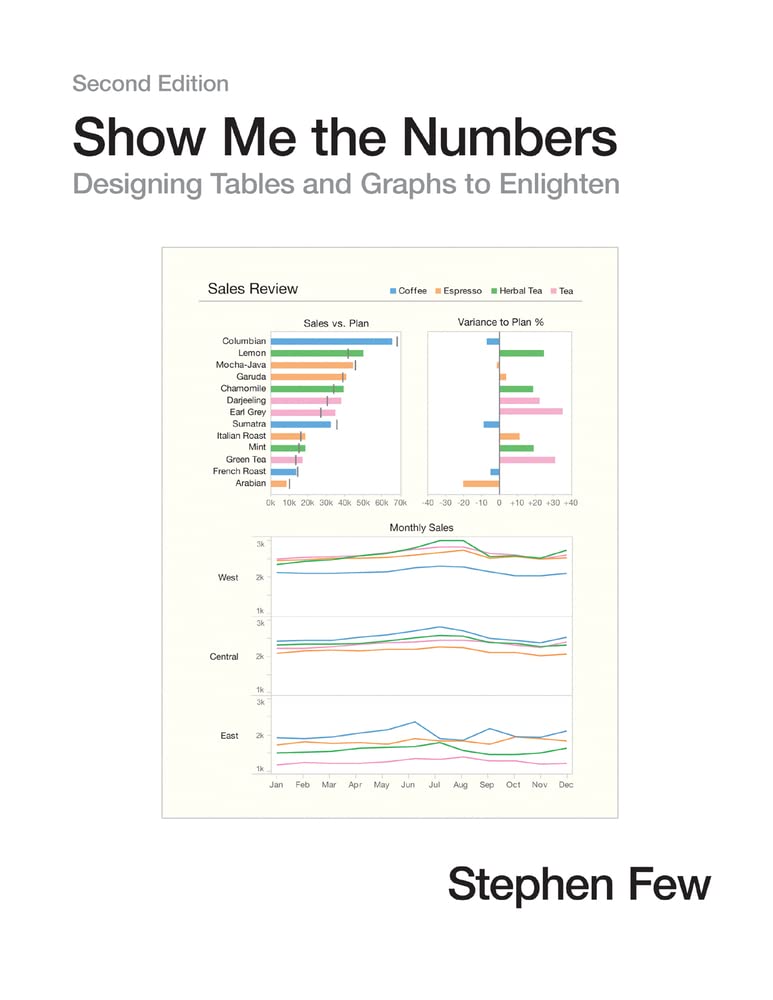
A must read for any one who has to design tables and graphs
The book was delivered in good condition and in time.The book gives you very simple tips to better the graphs and tables you design. Though simple, the tips are illuminating. The book is well written with many examples.
L**Y
Satisfied Reader
I have just started reading the book and I really like how Stephen Few explains the plotting process: in a concise and effective manner. Based on what I have read and seen in the book until now, I can say that I am pleased of purchasing this book, and, therefore, I give A++ to the book and its author.
A**O
Non per tutti
Il libro è un MUST HAVE per chi ha a che fare con la rappresentazione grafica dei dati e delle informazioni che questi devono fornire.Few è un maestro nell’impostare il modo di ragionare migliore: poi bisogna comunque soffrí.Ho anche un altro titolo del Dottor Few è questo qui chiude un ciclo (forse) iniziato per me con molto entusiasmo.
D**E
Me ha ayudado bastante
Excelente articulo
A**R
Great book. 100% recommended
Great purchase. If you are starting to get involved with data visualisation and you have no previous or reduced knowlage on data visualisation, this book is for you. It starts from something as basic as describing the type of data you can have till which graphs or tables could be better to communicate these data. However, no matter even if you have an advanced knowlage in data visualisation, this book will help you to understand things you usually do and even you can get a few tips more.The book is so easy to read. Even the stadistical explanations he provides are simple but accurate, providing the relevant knowledge you require. Also, it is really fun and interesting to read. It could look like a really technical book, but definitely it could be something you can sit in your garden, read and chill.If you think that you would require a mot advanced book but that approach the same knowlage, his book Now You See It is for you.Warning: this book is practical form the point of view that you learn to identify the best graphs for specific data, when you should use them, then using a table is preferable, how to use the colours in a graph etc. You develop a critical knowledge to identify if a graph is good or not and how could be improved. However, if you are expecting that he explains you how to do these graphs in excel or in other program, this is not the book you are looking for. Yet, it gives you a recommended reading appendix when you can find what you are looking for depending of your interests.
N**E
Very good book that summarizes data concepts in an easy way
This books helps to understand the basics of data visualization, it also provides exercises and lots of examples.
Trustpilot
2 days ago
2 weeks ago